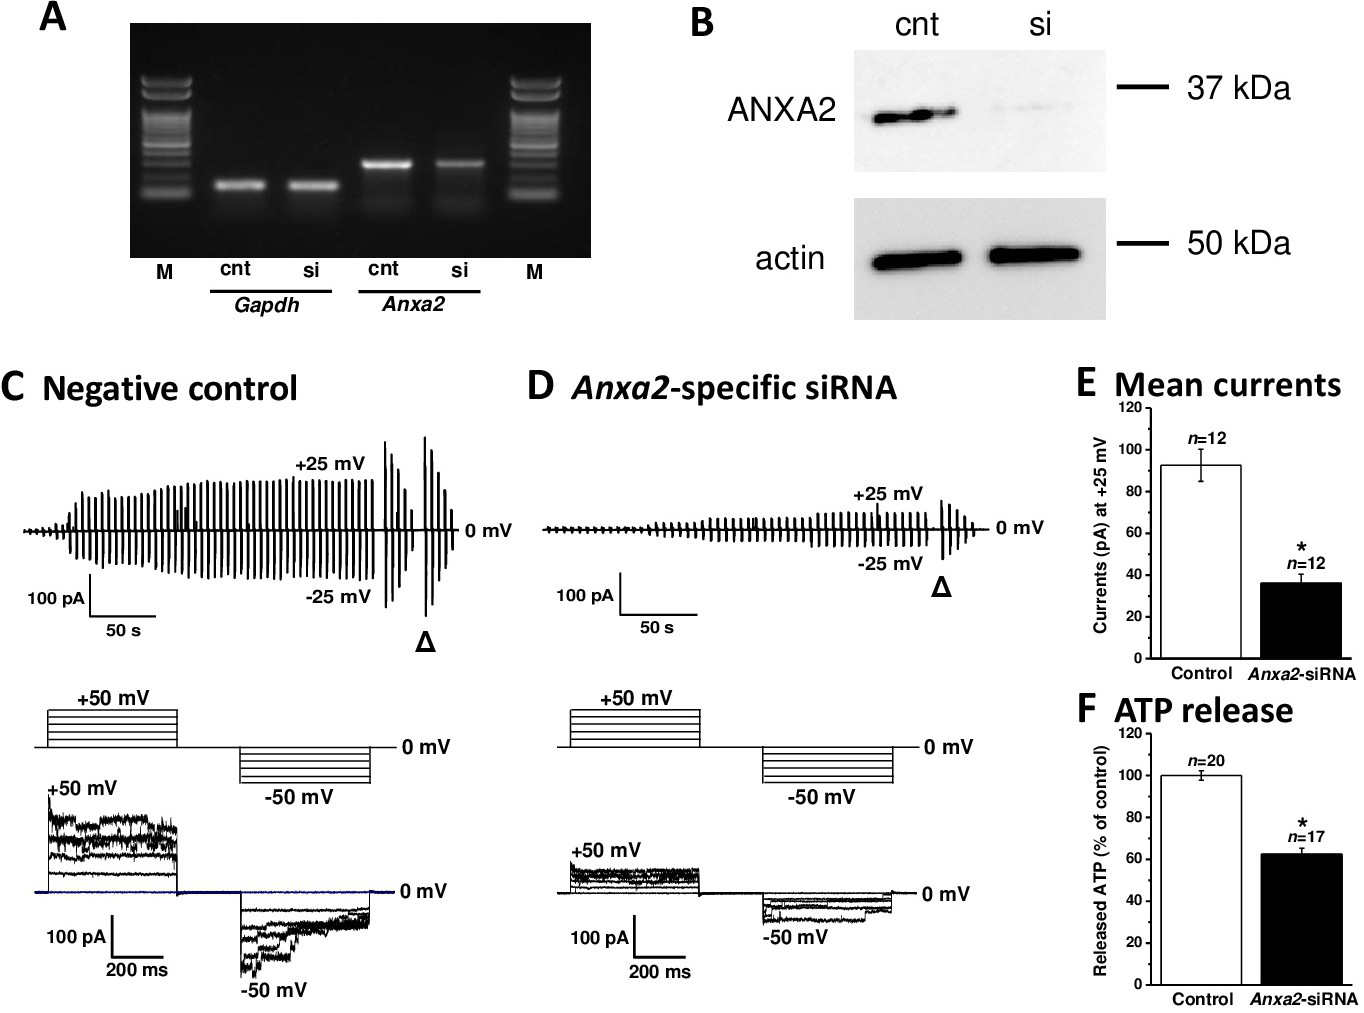
Fig. 2. Downregulation of Maxi-Cl activity by siRNA-mediated silencing of the expression of Anxa2 in C127 cells. A. Expression of ANXA2 mRNA (Anxa2) in C127 cells treated with non-targeting siRNA (cnt) or Anxa2-specific siRNA (si) detected by RT-PCR using Gapdh as a control. M: molecular size markers (100-bp ladder). The data represent triplicate experiments. B. Expression of ANXA2 protein in C127 cells treated with non-targeting siRNA (cnt) or Anxa2-specific siRNA (si) assessed by western blotting using anti-ANXA2 antibody. Beta actin was detected as an internal control. Molecular weight markers (in kDa) are indicated on the right. The data represent triplicate experiments. C, D. The effects of transfection with non-targeting (Negative control) and Anxa2-specific siRNAs on Maxi-Cl activity. Top panels show the representative time courses of Maxi-Cl current activation after patch excision from C127 cells transfected with non-targeting siRNA (C) and Anxa2-specific siRNA (D). During the records, alternating pulses from 0 to ±25 mV were applied. Bottom panels show the voltage-dependent inactivation pattern of Maxi-Cl currents elicited by applying voltage step pulses (500 ms) from 0 to ±50 mV in 10-mV increments at the time points indicated by triangles in upper panels. The pulse protocol is shown in middle panels. E, F. Summary of the effects of non-targeting siRNA (Control) and Anxa2-specific siRNA on the mean Maxi-Cl currents recorded at +25 mV (E) and on hypotonicity-induced ATP release from swollen C127 cells (F). Each column represents the mean ± SEM (vertical bar). *p<0.05 (Student's t-test) vs Control.